Listen to recordings of wind farm noise played alongside the noise levels
What is the Listening Room Experience?
Are wind farms really noisy? What does a wind farm sound like?
The primary aim of the exercise is to broaden understanding of wind farm noise. Whilst the issues surrounding wind farm noise are greatly discussed and debated, it has been experienced by relatively few in the profession or by those responsible for influencing the decision of whether nearby residents will experience this noise and if so to what extent.
The listening room experience aims to replicate listening to wind farm noise, particularly AM (Amplitude Modulation), in a home situation. Clips of wind farm noise are taken from MAS Environmental's own measurements in the field and within dwellings where complaints of wind farm noise have been made.
MAS feel that there is a specific need to hear and experience wind farm noise and amplitude modulation not necessarily because of the decibel level of the noise, but largely due to the character of the noise - the changing frequency content and its context within what is usually a very quiet rural environment.
Look for  buttons to listen to recordings of wind farms.
It is not uncommon to hear anecdotal evidence about wind farm noise and character; however, the majority of anecdotal evidence relates to visits to wind farms during day time and typically within close proximity of the turbines. These are not the same conditions or circumstances in which complaints from wind farm noise are made; find out more.
- Are you in interested in attending a listening room experience? Click here to contact us.
- Download the listening room pack including graphs (PDF File)
- Listen to Knabbs Ridge wind farm noise
- Listen to Kessingland wind farm noise
- Listen to Site D wind farm noise

The Listening Room Experience: Turbines on-off
View the Cotton Farm On-Off web graphBefore listening online to our web graphs please make sure you read and understand this information
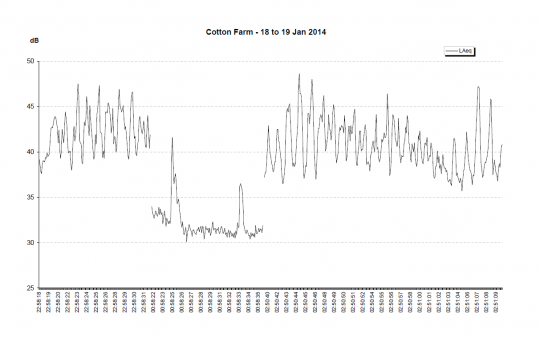
The data used in this graph is taken from a permanent monitoring station located at a resident's property in the village of Graveley approximately 700m from the nearest of 8 turbines. The station is constantly monitoring noise from the nearby the Cotton Farm wind farm. The monitor uploads the noise levels to the internet along with 10m high wind speed and wind direction data taken from a mast located next to the microphone. The uploaded data is freely available for local residents to monitor and log current readings of the wind farm. The residents are given a rating system for highlighting and archiving periods where wind farm noise occurs.
From this monitor we have combined the following short extracts of noise data and audio where the turbines were briefly turned off during a night of EAM that otherwise continued from 9pm on the 18th January until dawn on the 19th January. The church bells marking the beginning of the hour help to give some context to the change of acoustic environment experienced by the residents.
The Listening Room Experience: Knabbs Ridge Wind Farm
 View the Knabbs Ridge web graph
Before listening online to our web graphs please make sure you read and understand this information
This track is recorded at a mobile home site where many residents have sold up and moved out because of the wind farm. The track starts with a car on the road interspersed with turbine noise which dominates as the car fades away. Not all the turbines were audible or intrusive.
The track includes some periods of rumbling / roar, thumping, lashing and also more typical wind turbine noise. Listen again and see if you can hear the difference in noise character.
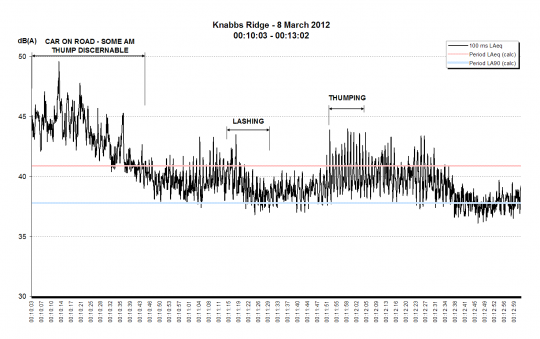
Located approximately 550m away from 3 turbines
The Listening Room Experience: Kessingland Turbines
View the Kessingland web graphBefore listening online to our web graphs please make sure you read and understand this information
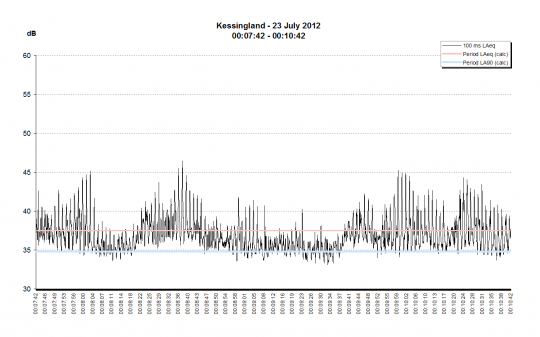
This track provides contrast. It starts with a car passing on a main road which partially but not totally masks the turbine noise. The peak to trough variations recorded were previously considered impossible by industry experts. Furthermore, the peak to trough variations were considered to reduce over distance. This clip provides significant contrast with what is a quiet environment absent the wind farm noise. Many characteristics are evident including the sudden drop in noise between peaks.
The turbines at Kessingland are now a regular, intrusive feature of the soundscape. As can be seen from the graphs below measured on two separate occasions to the above measurement, EAM is not infrequent in occurrence.
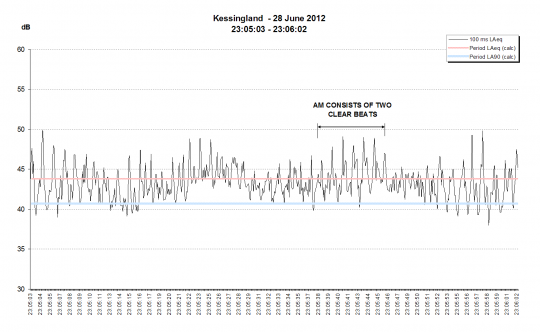
The extract below was measured under typical, high wind shear, conditions likely to lead to EAM. There is very little wind at ground level but the turbines are generating AM with a 10dB peak to trough difference as well as lower frequency EAM.
Located approximately 550m away from 2 turbines.
The Listening Room Experience: Kessingland Revisited
Click the graphs below to listen to themBefore listening online to our web graphs please make sure you read and understand this information
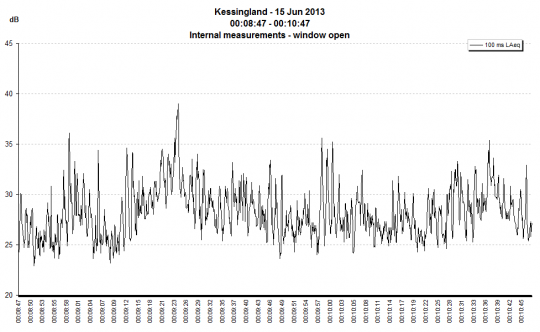
The noise from the Kessingland turbines can again be seen to clearly dominate the sound environment in the area. The graph below is another example of EAM measured approximately 600m from the turbines. Throughout the period road traffic noise can be heard and contrasts with the EAM from the turbines. The modulation peak to trough is regularly in the region of 10dB(A). Noise in the 200Hz third octave frequency band is dominant throughout and largely dictates the low frequency character of the EAM. The nature of the sound varies throughout the period both in frequency content and in modulation depth, increasing from a peak to trough range of approximately 3dB(A) to a peak to trough range of approximately 10dB(A) in a time frame of 4 seconds.
These measurements were recorded internally in a nearby affected resident's bedroom at the front of the property, facing the turbines.
It appears that despite the abundant evidence over 2 years, residents have not noticed any improvement to the noise they are subjected to.
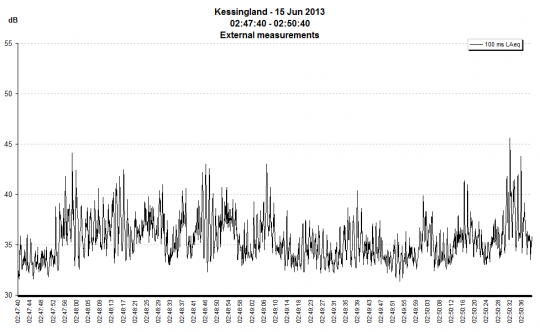
The extract below was measured two and a half hours later, the turbines are still generating EAM. The peak to trough range is approximately 9dB(A). Noise in both the 200Hz and 250Hz third octave bands is dominant. Wind conditions at ground level are very still apart from a couple of occasions when leaves can be heard rustling in the wind.
These measurements were recorded externally in the rear garden, screened by the house from the turbines. The matching internal is further down.
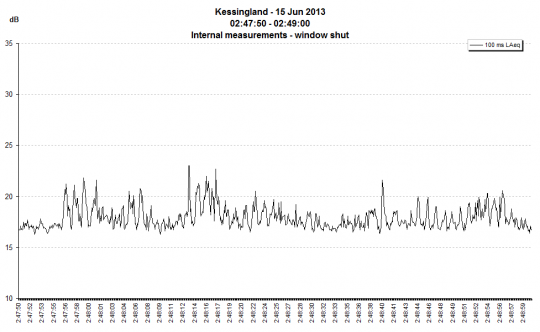
The extract below roughly corresponds to the first minute of the above period but was measured internally with windows shut. EAM is still clearly discernible and notably the mid-higher frequency component of the EAM is removed placing greater emphasis on the lower frequency content. Modulation phases in and out often with a peak to trough range of approximately 3-4dB(A). It is frequently argued by consultants that a change of 3dB(A) is only just perceptible.
The Listening Room Experience: Site D
View the 'Site D' web graphBefore listening online to our web graphs please make sure you read and understand this information
The measurements were made in an external amenity area location in a remote rural area approximately 1km from the wind farm. The site remains anonymous as requested by complainants and due to potential litigation. The graph compares a period when the turbines are not operating with a period just under half an hour later when the turbines are operating. There is approximately a 7dB increase in background noise level and the character of the soundscape is significantly altered. Note: this is 'typical' wind farm noise and would not be categorised as AM.
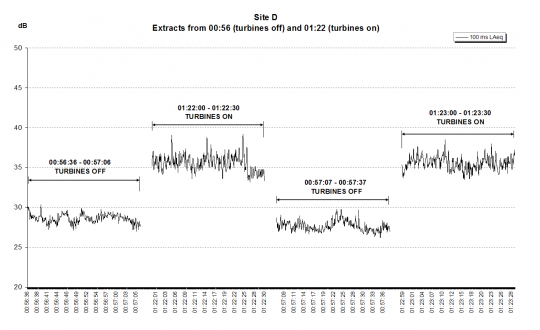
Located approximately 1km away from the wind farm.
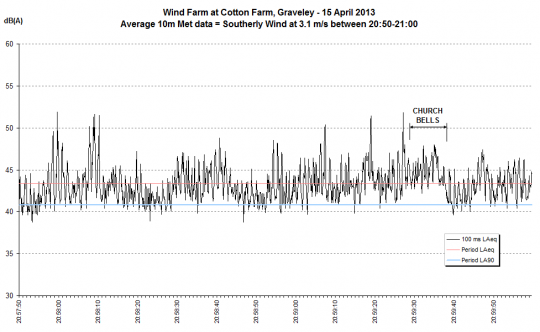
The Listening Room Experience: Cotton Farm
View the first Cotton Farm web graph View the second Cotton Farm web graphBefore listening online to our web graphs please make sure you read and understand this information
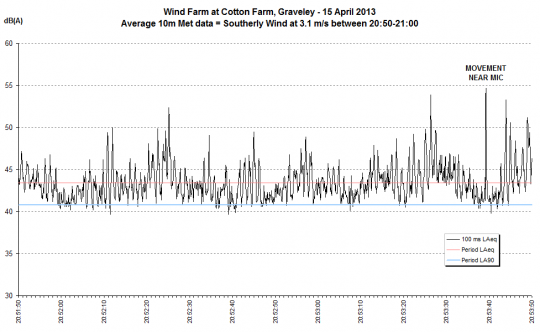
Measurements taken approximately 800m from the nearest turbine (8 turbines in total).
This is a rural location with excess amplitude modulation outside. Despite the wind farm only recently becoming operational and although conditions have not necessarily been indicative of EAM arising, EAM has already been found to occur at the Cotton Farm site. Concerns were raised by local residents soon after the wind farm became operational and this has been verified by our recent measurements, presented in the charts below. Towards the end of second sample period the local church bells can be heard. This would previously have been the only source of noise at night time in the area and helps to contextualise the difference in noise environment pre and post wind farm. At the Cotton Farm Wind Farm Farm Public Inquiry acoustic evidence submitted in support of the wind farm concluded 'given the small number of occurrences of increased level of 'blade swish' or AM, it is my view that an appropriate way to control the potential for the noise from a wind farm to contain increased levels of AM is by way of statutory nuisance action...'.
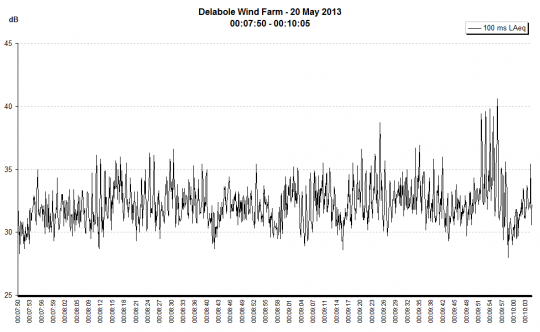
The Listening Room Experience: Delabole
View the Delabole web graphBefore listening online to our web graphs please make sure you read and understand this information
One of the first windfarms in the UK the Delabole wind farm has recently been redeveloped. The original wind farm was identified in ETSU-R-97 as causing noise complaints. The measurements below shown that the redeveloped wind farm is generating EAM. The location of the wind farm at Delabole, within close proximity of the coast and surrounding hilly landscape, indicates a high likelihood of EAM occurring.
The measurements below were recorded under meteorological conditions and at an angle from the turbines that would not be expected to result in worst case EAM. This suggests that in downwind inversion conditions noise impact could be much worse. Noise levels were measured at a distance of approximately 400m from the turbines at a nearby caravan site. Modulation phases in and out during the period, at the beginning of the period the peak to trough range is approximately 6dB(A) and has a greater proportion of lower frequency noise content. At the end of the period modulation increases unexpectedly from approximately 2-3dB(A) peak to trough to 6-9dB(A) peak to trough. Towards the end the peaks are dominated by a greater proportion of higher frequency noise content.
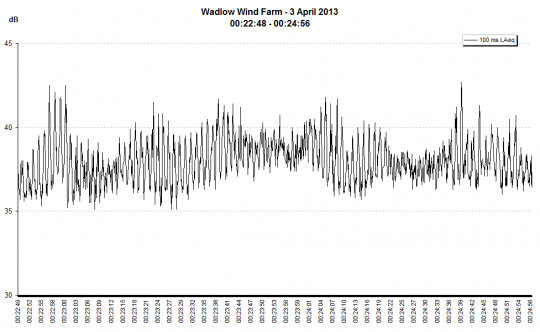
The Listening Room Experience: Wadlow
View the Wadlow web graphBefore listening online to our web graphs please make sure you read and understand this information
Wadlow wind farm become operational in 2012. At the Wadlow Wind Farm Public Inquiry the evidence submitted by Dr Bullmore on behalf of the developer concluded 'the likelihood of enhanced levels of AM occurring at the Wadlow Farm Wind Farm site is low'. At night time background noise levels in the area fall very low and the turbine noise dominates the soundscape.
The wind farm site is another flat landscape in eastern England, similar to the Red Tile Wind Farm and Deeping St Nicholas Wind Farm. Measurements were recorded approximately 1250m from the nearest turbine. Although the peaks are dominated by 400-630Hz third octave band frequency noise, the EAM has a low frequency noise character which is clearly discernible from recordings. Spectral analysis confirms a strong 100Hz third octave band frequency component often with peaks of 100Hz noise that exceed noise levels in the 400-630Hz third octave bands.