The Den Brook AM Condition
Click here to see our guide on how to test data using the Den Brook condition.
Following the discussion of the potential noise impact from amplitude modulation and excess amplitude modulation noise at the proposed Den Brook Wind Farm, MAS sought to draft a condition which would allow approval of wind development whilst maintaining protection of residents amenity. Since its conception the Den Brook condition has been revised and the most recent version is available to download below.
Following various appeals of the approval of the Den Brook wind farm, the developers are seeking removal of the condition. This is partly based on research by Jeremy Bass of RES which claims that there are issues with the condition and by others that the condition is not enforceable. Some also claim that the condition is based only on data from one wind farm. These criticisms are not just or true and a detailed response to these criticisms can be downloaded below. In addition, the link to an independent study demonstrating the application and enforceability of the Den Brook AM condition can also be found below.
MAS advised RES of a number of errors in their analysis which were acknowledged and corrected as far as possible. RES did not measure appropriate parameters or under meteorological conditions conducive to the occurrence of EAM and there was a number of unusual extraneous noise sources present. This is a little like measuring background noise in a busy city street during the day outside a restaurant where the extract fan is subject to a low noise limit and saying the noise limit is exceeded by other noise so the control is unworkable. The time the extract fan causes a problem is when other noise dies down during the quiet of night and as always there is a need to remove extraneous noise when assessing condition compliance. This process is actually made easy by the Den Brook condition as it is only certain modulating noise that could possibly trigger the limits, unlike conditions directed at average and percentile noise.
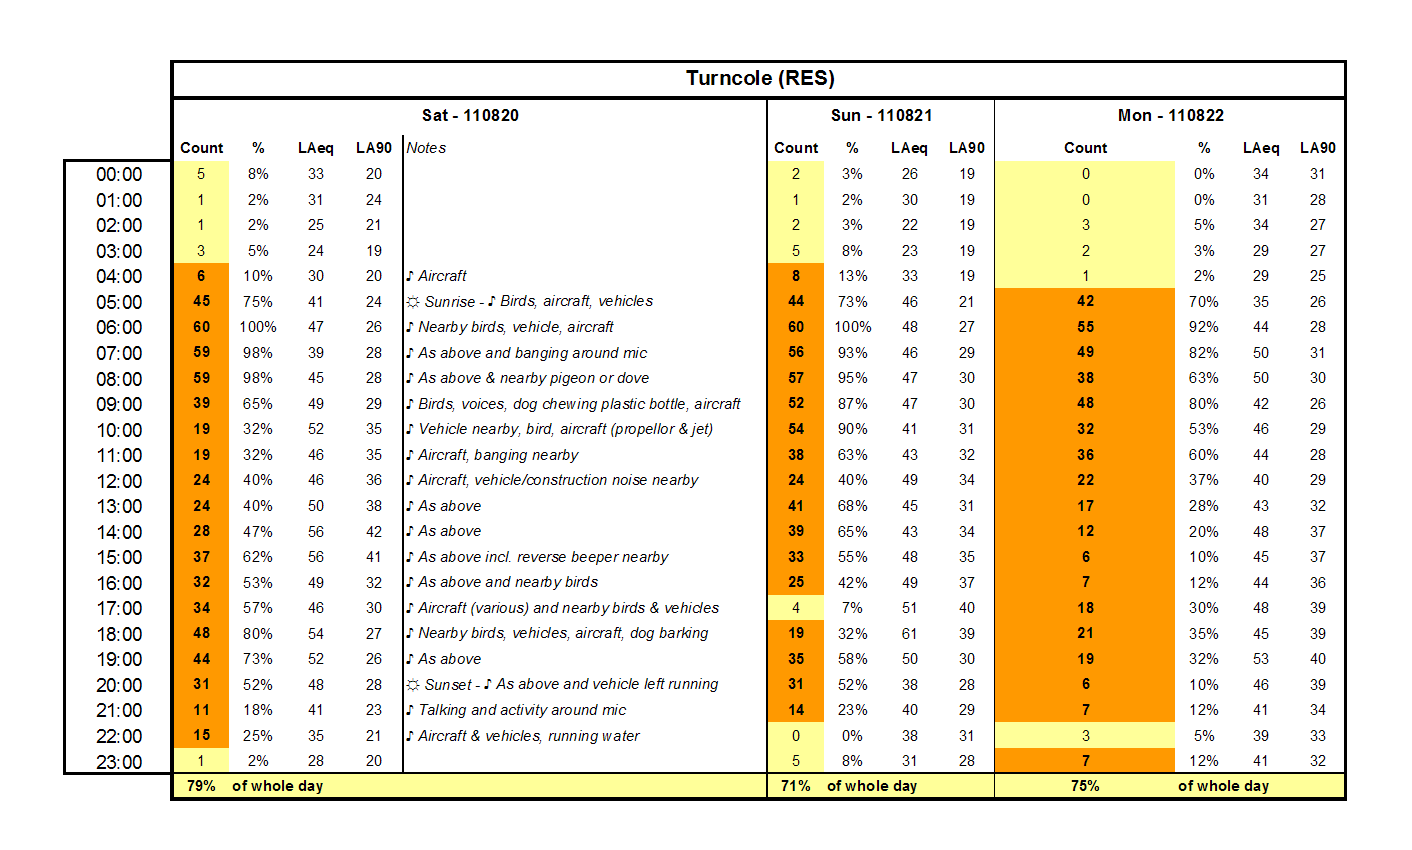
When MAS correctly applied the condition to the RES data it was found that during the hours when AM typically occurs (after sunset and before sunrise) no false positives were found. If false positives were identified, mainly during daytime, the trigger was clearly identifiable in the data; these were typically common noise sources that would be noted and disregarded when applying any noise condition, such as bird calls, aircraft and car alarms. The results of this analysis are given in the tables below.

Click to view full size
The orange highlighted cells indicate extraneous noise arising which triggered the EAM limits of the condition and so require examination as to cause. The yellow highlighted cells are not breaches. Notwithstanding that the condition would unlikely be applied during daytime hours (where there are the majority of orange cells) as with any LAeq level or limit applied to factories, entertainment venues etc there is always the problem of extraneous noise. It has always been the case that extraneous noise in any noise readings must be identified and excluded.
It can be seen from our analysis of the data that the extraneous noise source has readily been identified in every case. The extraneous noise is easily identified as the noise trace it produces is very different and listening to audio can immediately exclude it. Once processed into graphs a day of data can be analysed in a matter of minutes. Had Dr Bass adhered to this logic and applied the condition to times, conditions and locations when EAM is reported to occur the alleged "false positives" disappear. In any event enforcement of any condition requires examination of data to ensure it is from a source before relying upon it and thus the argument is without grounds. It also follows that if this condition is unenforceable then all noise conditions which could regularly be triggered by extraneous noise are unenforceable. This is the vast majority of them.
Click to view full size
- Revision to the Den Brook AM Condition proposed by MAS
- Independent study on enforceability of Den Brook AM condition: http://www.ref.org.uk/publications/242-the-den-brook-amplitude-modulation-noise-condition
How to check wind farm noise data against the Den Brook condition
What are you looking for
In one hour of external sound level data at least
- 6 separate one minute periods each with at least
- 5 events caused only by the wind turbines (not from any extraneous noise)
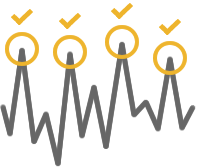
- that have a peak to trough of at least 3dB for each event.
- also, that minute must have an average LAeq of not less than 28dB
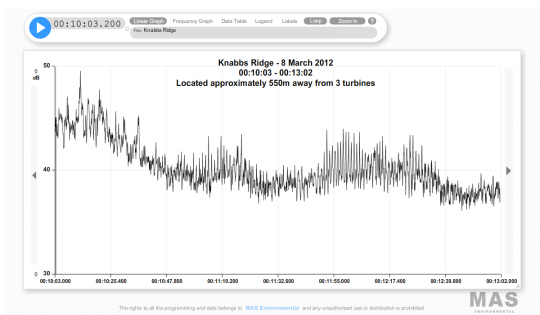
How to look for it (using our Listening Room Experience graphs)

When viewing the Listening Room Experience graphs, play the recording through headphones to listen to the noise. Run through the audio twice to become familiar with the various sources of noise. Take care to notice the character of the sounds and which affect the decibel level causing peaks.

Print off a copy of the graph (using screen print) to allow you to mark on the peaks that you find.

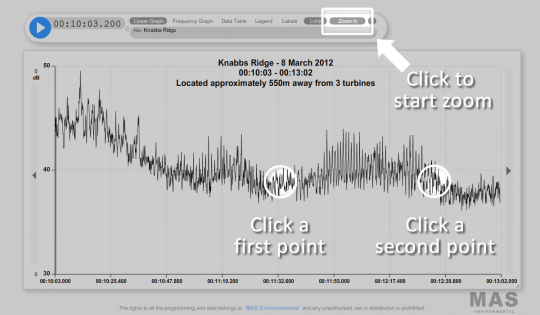
Use the "Zoom In" button to enlarge the graph on the screen until you can clearly see the points that make up the peaks. This process is shown in detail below.

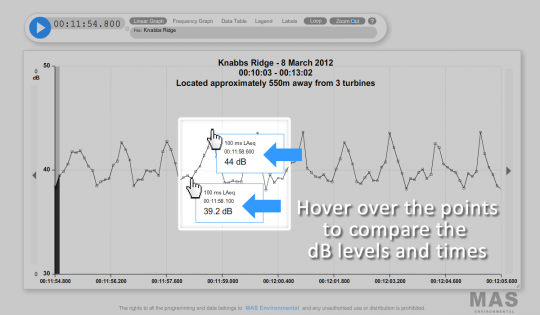
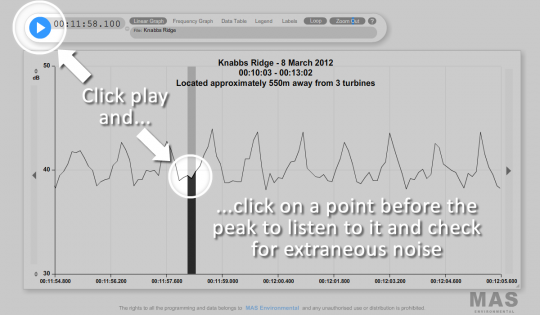
Hold the cursor over peaks on the graph to reveal their decibel value and time. Click a point before the peaks to start the audio playing at this point to be certain that there is no extraneous noise.
Compare the troughs either side of a peak within a total period of 2 seconds to see if the peak is at least 3dB higher than both troughs. Where it equals or exceeds 3dB, you have an event that counts.
Over a short period of time it becomes very easy to see peaks which are more than 3dB higher than the trough either side.
Once you have identified 5 peaks within a period of one minute, that minute is counted towards the 6 required within the hour of data. Make sure that the minute period has an average LAeq of 28dB or more.
Tips on identifying peaks
It is best to use peaks that have a continuous rise up to the peak and continuous fall after. Unusual peaks such as those that are jagged should be avoided where possible but are not strictly excluded by the condition. These are often caused by asynchronous AM from different turbines so you should find that there are converging peaks that are more appropriate.
Tips on identifying extraneous noise
The Listening Room Experience graphs on our website do not contain frequency data, however in practice you can use this information to eliminate peaks from extraneous noise. Wind turbine AM is easily identifiable by its frequency content both audibly and visibly. Typically around 125Hz – 630 Hz 1/3rd Octave Bands.
Additional analysis can be undertaken through the characteristic rate of rise and fall in levels for AM and how it differs from other environmental noise sources.
If extraneous noise is audible but does not appear to affect the level, i.e. it does not cause a peak in the graph, then you may choose to ignore this extraneous noise and count the event. In this situation it is best to use your own judgement, for example if the peak to trough is much greater than 3dB.

Try it out on our Listening Room Experience graphs
Please now try it out on the following Listening Room Experience graphs:
- Knabbs Ridge
- Kessingland
- Kessingland Revisited (external location only)
- Site D (see note below)
- Cotton Farm
- Delabole
- Wadlow