Introduction into the science of acoustics and what defines noise
To find out about our services in noise and acoustics, check out our other pages:
The science of sound
Sound is measured in decibels (dB). Decibels are units on a logarithmic scale. This means that if a sound doubles in intensity, rather than a doubling in decibel level a 3dB increase will be observed. Similarly, for a noise level to increase by 1dB the intensity must increase by a factor of 1.26. Sound is measured on a logarithmic scale because the range of sound levels perceived by the human ear is so vast. Measuring the ears response to sound on a linear scale would involve a scale ranging from 0.000001 to 200 compared with a decibel range of 0 to 140.
The physical effect of noise on the ear varies greatly depending on many factors. Of key importance is how loud the noise is; however, the frequency of the noise and length of time to which the ear is exposed to the noise will also contribute.
Frequency The ear is more sensitive to higher frequency sounds than lower. This means that a low frequency sound of equal decibel level to a higher frequency sound will appear to be quieter.
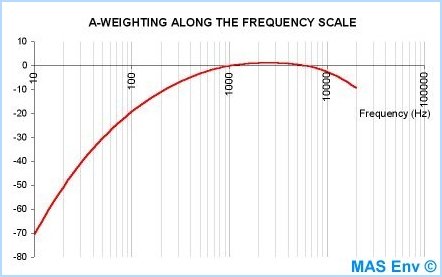
A-weighting To reflect the ears differing sensitivity to frequency, when measuring sound in decibels a deduction is applied to certain frequencies. The results of these calculations form the A weighting scale as shown graphically at the bottom of the page.
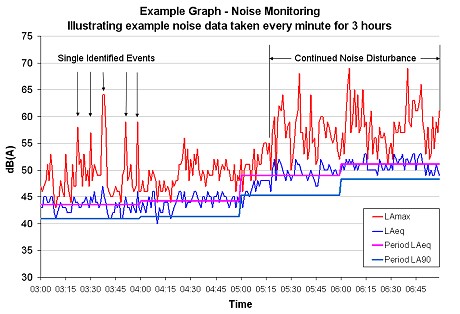
With reference to the graph on the About Noise Services page, you will see that the y-axis is labelled as dB(A) and contains data for LAmax, LAeq and LA90 levels. The ‘A’ in all of these parameters refers to the use of the A weighting scale.
The LAmax shows the highest noise level reached in a given time period.
The LAeq is essentially an average noise level. More specifically, it shows the equivalent amount of energy in a given period for a fluctuating source as if it were a steady continuous noise level.
The LA90 is used to give an accurate approximation to the background noise level, i.e. the sound level that would be expected if the noise disturbance wasn't present.
As you can see in this graph below, A-weighting reduces the lower (and some of the higher) frequencies in the noise readings to reflect how they would be perceived by the ear.
Here are some typical dB levels of noise:
| Noise Source | Typical dB(A) |
| Urban Background (late night) | 40-50 |
| General Office or Supermarket | 60 |
| Car at 25mph (7.5m) | 70 |
| Heavy Goods Vehicle passing pavement | 90 |
| Pneumatic Drill (5m) | 100 |
| Loud Disco (1m from speakers) | 120 |
Did you know...?
? A change of 3 dB is noticeable to most people ?
? An increase of 10dB is twice as loud ?
? Double the distance from the noise source reduces the noise by 6dB ?
? Adding two equal sounds causes a 3 dB increase ?
Noise exposure at work
The "rule of thumb" is that the MAXIMUM daily exposure to these noise levels in an average 5 working day week...
- 85 dB for 8 hours
- 88 dB for 4 hours
- 91 dB for 2 hours
- 94 dB for 1 hour
- 97 dB for 30 mins
If these are exceeded in a working environment then action MUST be taken by the employer to reduce the risk of noise induced hearing loss. Failure to do so puts the employee's health at great risk.
We produce posters which illustrate the Control of Noise at Work Regulations exposure times and levels, click here for an example. The thermometer shows the action levels on the left (in dB) which correspond to the length of time at which action must be taken on the right. Therefore, if you are working in a factory environment of 92dB for more than 30 mins, ear protection and training must be provided by law.
Any exposure to noise will have an effect on hearing. Extremely loud noises can cause instant damage, but regular exposure to low level noise will also be harmful.
For more information check out our page on Noise at Work
About Noise Services
Noise disturbances are a large part of the service we offer, ranging from domestic complaints to large-scale acoustic planning.
The word NOISE refers to unwanted and unpleasant sound. Exposure to noise can be more damaging than you may realise with the most obvious and severe result being deafness. Other than physical damage to the actual hearing mechanisms of the ear, unwanted noise or sound can induce stress and may hinder concentration. If noise or sound is sufficiently distracting to cause a lapse in attention, a serious accident may result.
At MAS Environmental we provide a service to anyone having problems with noise, using the latest technology and expertise.
A typical example would be a commercial site disturbing a residential neighbourhood, for example a factory or nightclub. MAS Environmental might be approached by either the local council or the residents themselves. With the use of noise monitoring equipment, measurements of the level of disturbance could be taken and employed for use in various ways and situations. Below is an example of a noise monitoring data graph commonly used in formal reports or as evidence in court to help illustrate the extent of the disturbance.
If significant disturbance was found, MAS Environmental may approach the company and alert them to the problem. Through consultation with the company and the local council an action plan outlining the procedures for reducing noise levels could be developed. This might include locating the problem source(s), measuring, calculating and predicting noise levels, planning possible changes and providing advice on acoustic insulation schemes and other noise reduction solutions.
MAS Environmental have been responsible for both advising and implementing many successful noise reducing solutions for a wide range of problems.